Cycle Convergence Framework
Cycle Convergence Framework
Five independent pillars. One zone. Calibrated on every confirmed BTC cycle extreme since 2015.
Quick answer
The Cycle Convergence Framework (CCF)is FynSight's five-pillar model for identifying when Bitcoin approaches historical cycle lows or highs. Each pillar votes independently. Three aligned votes activate a zone. MVRV plus RSI together form the Power Signal for high conviction. Calibrated on 9 bottoms and 9 tops since 2015. Observations only, not investment advice.
Confirmed bottoms
9
Since 2015 calibration
Bottom RSI rule
<27
Never broken in dataset
Top accuracy
81%
Lower at 180d when score >60
What is the Cycle Convergence Framework?
- Cycle Convergence Framework (CCF)
- A five-pillar voting model that maps where Bitcoin sits between historical cycle lows and highs by requiring multiple independent indicators to align before declaring a cycle zone.
Most Bitcoin analysis tools answer the wrong question. They tell you whether momentum is positive or negative today. They do not tell you whether today resembles a generational bottom, a distribution top, or a mid-cycle pullback that will resolve higher within months.
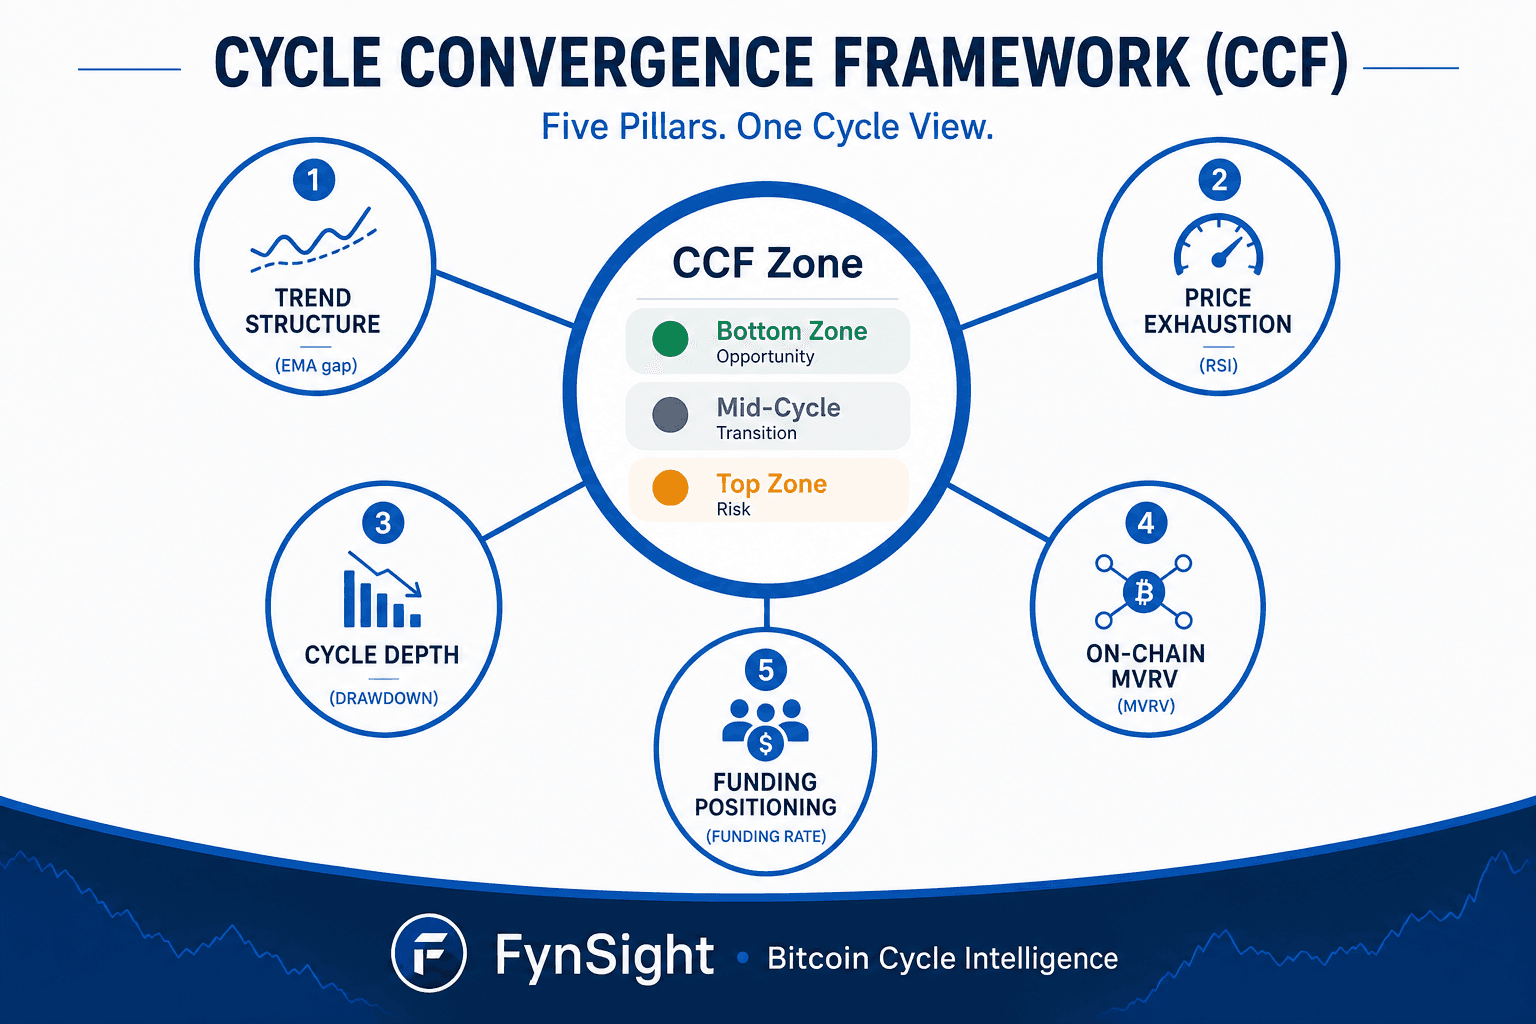
CCF was built to answer the cycle question. Not "should I buy now?" but "what kind of market is this in a multi-year context?" The framework watches five analytical families that have historically diverged at cycle extremes: trend structure, price exhaustion, cycle depth, on-chain holder economics, and leveraged positioning in perpetual futures.
Each family votes cycle-low, cycle-high, or neutral. Votes are binary at calibrated thresholds derived from every confirmed structural extreme since 2015. When three or more pillars agree, a zone activates. The zone is a context label, not a trade instruction.
Bottom Zone
3+ pillars vote cycle-low
Mid-Cycle
Mixed / neutral votes
Top Zone
3+ pillars vote cycle-high
Why standard indicators fail at cycle extremes
RSI below 30 is the most common "Bitcoin bottom" rule on social media. It is also one of the most misleading if used alone. On the 2022 decline from $69,000 to $16,000, RSI dipped below 30 multiple times before the actual November 2022 bottom. Each dip looked like exhaustion. Each dip was followed by lower prices.
MACD crosses, Bollinger touches, and Fear & Greed extremes suffer the same problem. They are designed for timing entries within a trend, not for identifying THE bottom or THE top of a multi-year cycle. A single indicator fires repeatedly because markets grind through fear in stages.
The research insight behind CCF is convergence. Industry frameworks like the Bitcoin Clarity Index, Colin Talks Crypto Bull Run Index, and multi-signal on-chain composites all share this principle: no single metric is sufficient. When valuation, momentum, depth, on-chain economics, and positioning align simultaneously, the signal density rises sharply.
FynSight's contribution is a transparent, pillar-by-pillar breakdown calibrated specifically on local extrema rather than arbitrary date ranges. You can see exactly which pillar voted and what threshold it needed to cross. Nothing is hidden inside a black-box composite.
Research methodology
The calibration script used scipy.signal.argrelextrema with order=120 on Bitcoin daily closes. That finds price points where BTC was the lowest or highest in a 120-day window on both sides. Noise wiggles are filtered out. Only structural market extremes remain.
At each extreme date, the script measured EMA 10/100 gap, RSI, Bollinger Band %, drawdown from 1-year high, distance from 200-day MA, proximity to 200-week MA, MVRV from CoinMetrics, and average perpetual funding rates. Forward returns were tracked at 30, 90, 180, and 365 days.
Nine confirmed bottoms emerged: 2015, Jun 2018, Dec 2018, Mar 2020, Jul 2021, Nov 2022, Sep 2024, Apr 2025, and Jun 2026. Nine confirmed tops emerged across the same period. Thresholds were set where indicators showed the strongest historical consistency, not where they looked best in hindsight.
The five pillars explained
Trend Structure
Measures how far the fast EMA has detached from the slow EMA. Deep negative gaps mark capitulation phases; large positive gaps mark parabolic extensions.
Bottom: EMA 10/100 gap < -8%
Top: EMA 10/100 gap > +20%
Price Exhaustion
The most reliable single-family signal. RSI below 27 appeared at every confirmed bottom since 2015 without exception.
Bottom: RSI < 30
Top: RSI > 70
Cycle Depth
Combines drawdown from the 1-year high, distance from the 200-day MA, and proximity to the 200-week MA generational support.
Bottom: Drawdown > -25% from 1y high, below 200D MA
Top: Drawdown near 0%, well above 200D MA
On-Chain MVRV
Market cap vs realized cap. Below 1.0 means average holders are underwater. Above 2.5 means broad profit-taking zone. Catches mid-cycle false bottoms that RSI alone misses.
Bottom: MVRV < 1.0
Top: MVRV > 2.5
Funding Positioning
Perpetual futures funding rates show leveraged crowd positioning. Extreme negative = shorts paying longs. Extreme positive = long cascade risk.
Bottom: Avg funding < -15% APR sustained
Top: Avg funding > +30% APR sustained
Pillar 1: Trend Structure
The EMA 10/100 gap measures how far the fast moving average has detached from the slow one. At deep bottoms, this gap is always negative and large. Dec 2018 printed -36.0%. Nov 2022 printed -16.4%. Average across all bottoms: -15.2%. At tops, the gap is positive and extended. Dec 2017 hit +93.6%. CCF bottom vote: gap below -8%. Top vote: gap above +20%.
Pillar 2: Price Exhaustion
RSI measures momentum exhaustion. Bollinger Band % shows how far price has stretched below the statistical range. RSI below 27 appeared at every confirmed bottom without exception. Average: 21.1. At tops, RSI was above 75 every time. Average: 81.6. This is the most reliable single-family signal, but CCF never uses it alone.
Pillar 3: Cycle Depth
Three sub-signals combine: drawdown from the 1-year high, distance below the 200-day MA, and proximity to the 200-week MA. Average drawdown at bottoms: -56.8%. Dec 2018 hit -83.9%. The 200-week MA near $62,153 in mid-2026 acts as generational support. It was breached during panic bottoms and held during recovery phases.
Pillar 4: On-Chain MVRV
MVRV compares market cap to realized cap. Below 1.0 means average holders are underwater. Above 2.5 means broad profit distribution. This pillar catches false bottoms that RSI cannot. Jul 2021 had RSI below 27 but MVRV 3.36. The real bottom came 16 months later at MVRV 0.75.
Pillar 5: Funding Positioning
Perpetual futures funding shows where leveraged traders are crowded. Negative funding below -15% APR means shorts pay longs. Positive funding above +30% APR means long cascade risk. Nov 2021 saw +100%+ APR before the top. Dec 2018 and Nov 2022 both showed deeply negative funding before the turn.
Zone logic: how votes combine
Bottom Zone
3+ pillars vote cycle-low
Mid-Cycle
Mixed / neutral votes
Top Zone
3+ pillars vote cycle-high
- 3+ pillars vote cycle-low → Bottom Zone (moderate conviction)
- 4+ pillars vote cycle-low, or MVRV + Exhaustion both fire → Bottom Zone (high conviction)
- 3+ pillars vote cycle-high → Top Zone (moderate conviction)
- 4+ pillars vote cycle-high, or MVRV + Exhaustion both fire → Top Zone (high conviction)
- Otherwise → Mid-cycle / neutral watch
Zones are labels, not commands. A bottom zone means conditions resemble historical periods where major lows formed. A top zone means distribution risk is elevated relative to the calibration set. Mid-cycle means mixed votes with no convergence.
The Power Signal
Quick answer
When MVRV and price exhaustion (RSI) both vote the same direction simultaneously, CCF conviction upgrades to high automatically. This combination has not produced a false zone signal in the historical calibration set.
Jun 2026 at $60,867 nearly triggered a high conviction bottom. RSI hit 6.2. MVRV was 1.135. Both exhaustion and on-chain pillars fired together. Price has since recovered to the low $60,000s with RSI back near 41, meaning the active extreme may be behind us unless another leg down retests the zone.
Historical bottoms (calibration set)
| Date | Price | RSI | MVRV | Notes |
|---|---|---|---|---|
| Aug 2015 | $210 | 23.3 | — | — |
| Jun 2018 | $5,903 | 26.6 | — | -18.9% |
| Dec 2018 | $3,237 | 26.1 | 0.69 | -36.0% · -83.9% · +121% |
| Mar 2020 | $4,971 | 6.6 | — | -64.0% |
| Jul 2021 | $29,807 | 23.7 | 3.36 | -18.9% · -54.0% |
| Nov 2022 | $15,787 | 25 | 0.75 | -16.4% · -73.4% · +127% |
| Sep 2024 | $53,949 | 26 | — | -6.1% |
| Apr 2025 | $76,272 | 26.6 | — | -8.2% · -12.2% |
| Jun 2026 | $60,867 | 6.2 | 1.135 | -51.8% |
Dec 2018 and Nov 2022 are the cleanest generational bottoms. Both showed MVRV below 1.0, RSI below 27, deep drawdowns, and negative funding. One-year forward returns: +121% and +127% respectively. Past patterns are not forecasts.
All bottom signal thresholds →Historical tops (calibration set)
| Date | Price | RSI | Notes |
|---|---|---|---|
| Dec 2015 | $465 | 81.1 | — |
| Jun 2016 | $766 | 89.4 | +35.1% |
| Dec 2017 | $19,497 | 78.7 | +93.6% |
| Jun 2019 | $13,016 | 95 | — |
| Feb 2020 | $10,326 | 75.8 | — |
| Apr 2021 | $63,503 | 75.3 | — |
| Nov 2021 | $67,567 | 75.2 | — |
| Mar 2024 | $73,084 | 80.1 | +37.7% |
| Oct 2025 | $124,753 | 83.4 | — |
Oct 2025 at $124,753 is the most recent major top in the dataset. RSI 83.4, MVRV 2.29, multiple pillars elevated. Five-month forward drawdown: approximately -47%.
All top signal thresholds →Backtest results
Bottom score > 60
- 58% positive at 90 days
- Avg forward return: +47% in 90 days
- False positive rate: 42%
Fear is chaotic. Bottoms grind or crash fast. Tops cluster cleanly when euphoria is uniform.
Top score > 60
- 81% lower at 180 days
- Avg drawdown: -34% in 180 days
- False positive rate: 19%
Top signals are more reliable than bottom signals in the historical sample.
Tops are more reliable than bottoms in the backtest. Greed clusters. Fear disperses. This asymmetry is real and the framework reflects it. Use top zones for risk context. Use bottom zones for accumulation context. Neither is a timing tool.
Full backtest methodology →How to use CCF in practice
Step one: check the live pillar panel on the cycle position page. Step two: count converging votes. Step three: note conviction level. Step four: use the zone for context on position sizing outside any automated system, not as a trade trigger.
If you watch one number, watch MVRV approaching 1.0. Every generational bottom in the dataset broke below that line. It is currently near 1.13 as of early July 2026. A retest of $55,000 to $60,000 on negative funding would likely activate multiple pillars simultaneously.
Frequently asked questions
What is the Cycle Convergence Framework (CCF)?
CCF is FynSight's five-pillar model for mapping where Bitcoin sits between historical cycle lows and highs. Trend structure, price exhaustion, cycle depth, on-chain MVRV, and funding positioning each vote independently. When three or more pillars align, a cycle zone activates with moderate or high conviction.
Who created the Cycle Convergence Framework?
CCF was built by the FynSight research team using scipy local extrema detection on Bitcoin daily data since 2015, calibrating indicator thresholds at nine confirmed bottoms and nine confirmed tops, then backtesting forward returns at 30, 90, 180, and 365 days.
How is CCF different from using RSI alone for Bitcoin bottoms?
RSI below 30 can trigger 20 or more times during a single bear market. CCF requires convergence across five independent analytical families before declaring a zone. MVRV specifically filters mid-cycle pullbacks like Jul 2021, where RSI was exhausted but the coin was still structurally mid-cycle.
What is the Power Signal in CCF?
When on-chain MVRV and price exhaustion (RSI) both vote cycle-low or cycle-high at the same time, conviction upgrades to high automatically. In the historical calibration set, this combination has not produced a false zone signal.
Is CCF a buy or sell signal?
No. CCF is a context tool. It reports when market conditions resemble historical zones where major cycle extremes formed. FynSight does not publish price targets, timing calls, or investment recommendations.
What MVRV level marks a Bitcoin cycle bottom in CCF?
CCF uses MVRV below 1.0 as a bottom pillar vote. Dec 2018 printed 0.69. Nov 2022 printed 0.75. Every time MVRV broke below 1.0 in the calibration dataset, it marked a generational accumulation zone.
Are Bitcoin top signals more reliable than bottom signals in CCF?
Yes in the backtest sample. Top composite scores above 60 showed lower prices within 180 days 81% of the time with a 19% false positive rate. Bottom scores above 60 were positive at 90 days only 58% of the time with a 42% false positive rate.
Where can I see the live CCF reading?
The live zone, conviction level, and all five pillar votes appear on the Bitcoin cycle position page, the crypto hub, and the Bitcoin deep-dive asset page. Data refreshes on a near-live cadence from the FynSight API.
FynSight provides market observations only. Not a SEBI-registered investment advisor. No buy, sell, or hold language. Zones are context tools, not trade signals.
Related guides in this cluster
Common searches about Bitcoin cycle tops and bottoms, mapped to FynSight CCF pages.
Explore the CCF cluster
FynSight provides market observations only. Not a SEBI-registered investment advisor. No buy, sell, or hold language. Zones are context tools, not trade signals.